Who Was Actually Buying That Candle?
A green candle looks like a settled argument. Price opened, buyers arrived, and price closed higher. On a chart, the story seems simple: buyers won.
But nothing in that shape tells you that a large holder may have been selling into every level of the move, or that the move kept going because incremental demand was sufficient to absorb available supply at progressively higher prices.
The question worth asking is not simply who was selling. It is who was actually bidding behind the candle.
The Candle Is a Result, Not a Description
A candle only records where the market traded. It says nothing about who was standing on either side of it. Large holders can continue selling into a rising market while price advances, as long as new demand keeps absorbing that supply at progressively higher prices. The result can look like straightforward buying pressure on the chart, even when substantial selling is taking place throughout the move.
A clean bullish move on your screen can therefore contain a constant battle between buyers and sellers. Somebody was almost certainly selling the whole way up.
That is not a problem with the move. It is a question about it.
For Somebody to Sell, Someone Has to Keep Buying
A holder distributing into strength can only keep distributing while new buyers keep showing up. The moment demand thins, the supply becomes visible and price stalls.
A market that keeps advancing through persistent selling is telling you something more useful than "buyers won." It is telling you demand kept arriving faster than holders could exit.
Which turns the question into one that can actually be answered: where did those buyers come from, and what was that demand made of?
Not at wallet level, but at the level of what pulled participants in and what kind of participants they were. Not at wallet level, but at the level of what pulled participants in and what kind of participants they were. Nodiens processes over 10 million data points a day across X, Telegram, Reddit, and other public channels to make that layer readable.
Movement Is Not Pressure
Price can move sharply for very different reasons. A move supported by sustained spot demand tells a different story from one driven primarily by leverage. Both can produce a green candle, but the underlying demand is not the same.
Price movement and market pressure are related, but they are not the same thing.
A market can move sharply because liquidity thinned, positions were covered, attention exploded, or genuine demand overwhelmed available supply. Those conditions can produce candles that look almost identical while representing completely different markets.
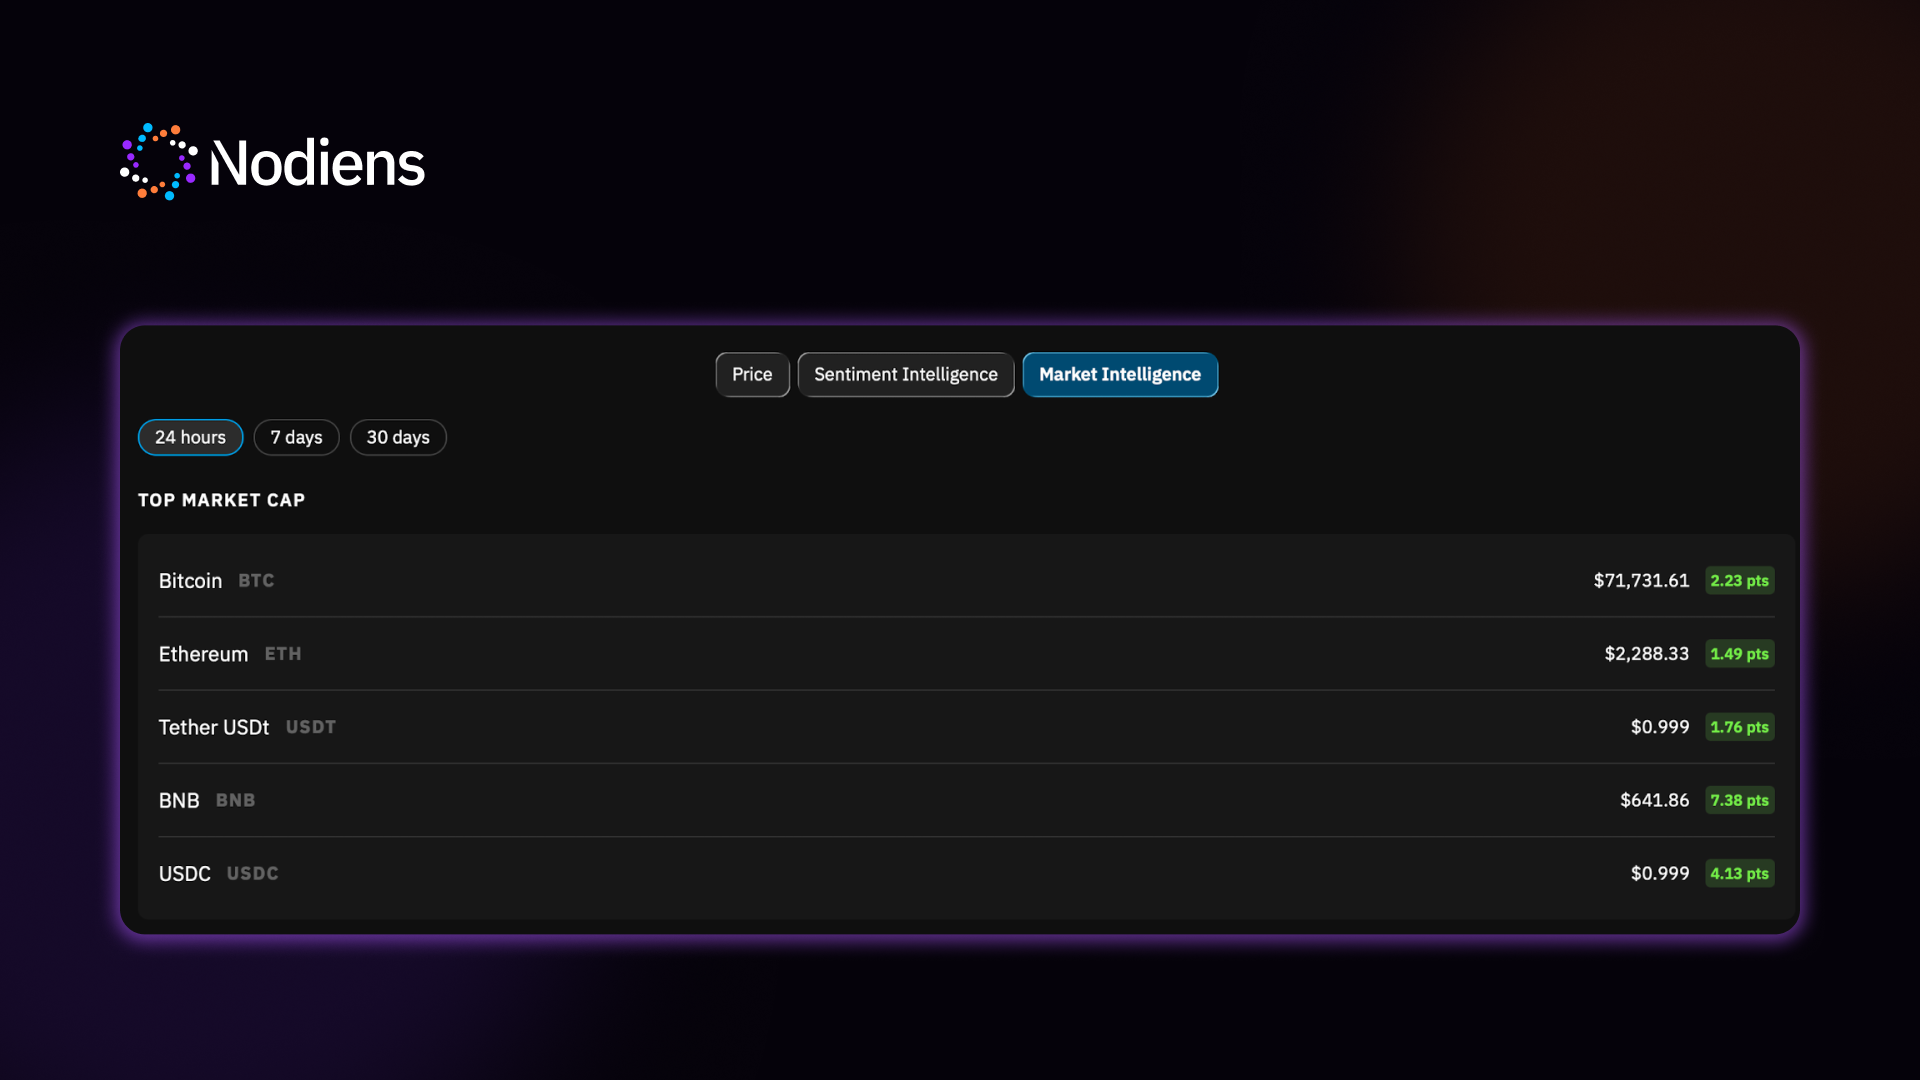
The Nodiens Market Intelligence Index measures the strength of market pressure behind a price movement. The point is not simply that price moved, but whether the participation surrounding that move was expanding or hollow. A move absorbing real supply on strengthening pressure and a move drifting up on thin books can be the same candle and completely different markets.
Attention Can Arrive Before the Buyers Do
Buyers do not appear from nowhere. Something puts an asset in front of them first. An asset starts appearing across more communities. Discussion volume rises above its normal range. New participants begin investigating while price is still relatively quiet. The Nodiens Spike Attention Index measures those unusual shifts in social attention, on a scale of -100 to +100.
That creates a useful sequence. Attention expanding ahead of price is where arriving demand first becomes visible. The candle confirms that the transaction happened, while the attention signal describes the conditions that were in place before the other side of it showed up.
Attention Is Not the Same as Conviction
Attention can be manufactured. Repetition, coordinated posting, recycled hype, and shallow engagement loops can all produce visibility without producing conviction. So attention on its own does not tell you whether the arriving demand was worth anything.
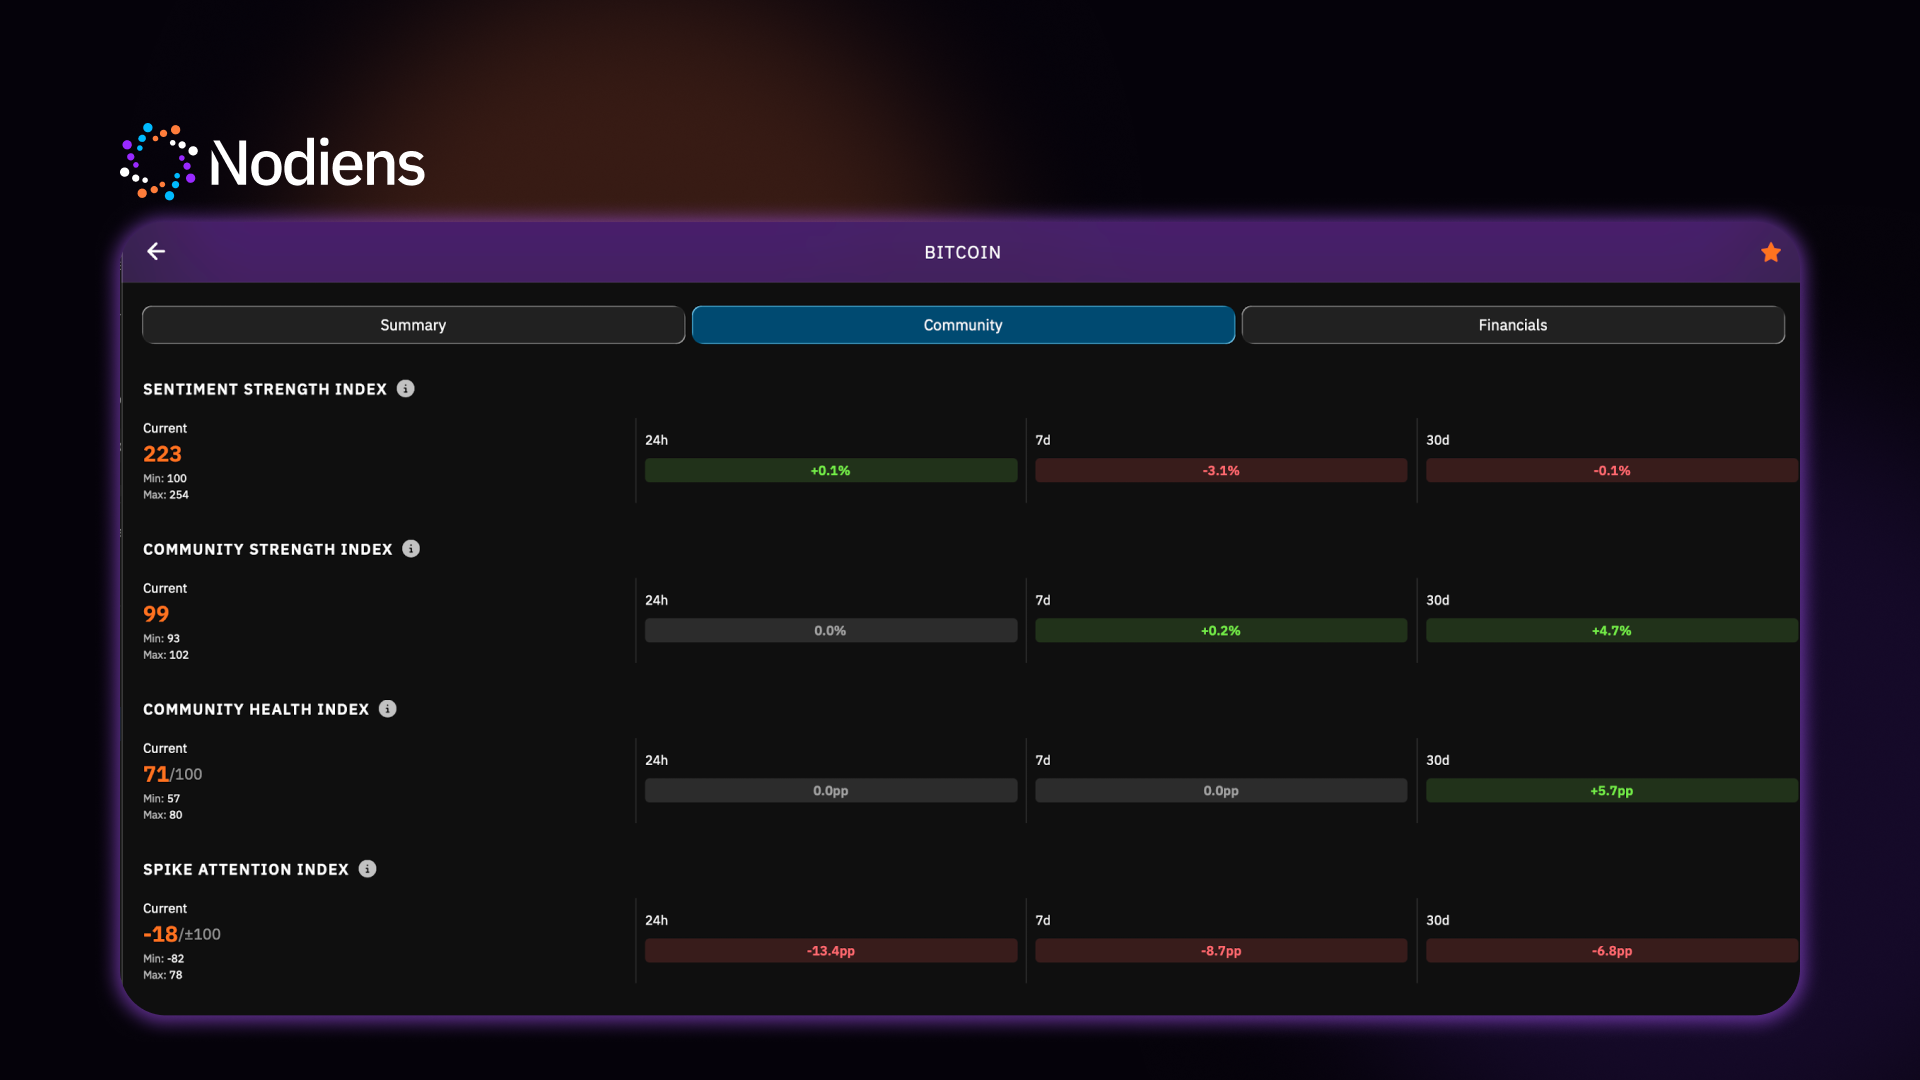
The Nodiens Community Strength Index measures the depth and quality of engagement around an asset, starting from a baseline of 100. The Nodiens Community Risk Index runs from 0 to 100 and reads the social layer for signs of artificial activity, including bot spam, coordinated messaging, fake engagement, and abnormal linguistic and account patterns. It is not a measure of holder distribution; it is a measure of whether the conversation pulling buyers in was real.
Low NCR means risk stayed contained while attention expanded. That combination is the difference between a crowd that showed up and a crowd that was assembled.
The most interesting signal is not always when every index moves in the same direction. Sometimes the divergence matters more: price may rise while attention fades, market pressure weakens, or community strength fails to follow. These mismatches can reveal a move that looks strong on the chart but is losing support underneath.
The same green candle can represent very different markets. It might reflect sustained spot demand, a leveraged short squeeze, distribution being absorbed by new buyers, or a sudden burst of attention that has not yet become durable demand. The candle looks the same; the underlying conditions are not.
When the Layers Agree
The same green candle can represent very different markets. It might reflect sustained spot demand, a leveraged short squeeze, distribution being absorbed by new buyers, or a sudden burst of attention that has not yet become durable demand. The candle looks the same; the underlying conditions are not.
One index moving is a data point. Several moving together is a structure.
Attention expanding, community strength building, risk staying contained, market pressure strengthening, and price responding last. When those layers line up, the absorption you are watching has genuine demand underneath it. NCR adds another layer by identifying abnormal coordination, concentration, synthetic engagement, and behavioral anomalies that can distort the signal. For traders, the questions become practical: Is participation broadening? Is the move absorbing supply? Is attention leading or chasing price? Is market pressure confirming the narrative?
When attention spikes while community strength stays flat and NCR climbs, the buyers arriving may be the product of noise, not evidence of durable demand. That divergence is the signal to look closer.
The Trap of the Perfect Green Candle
Price breaks resistance, volume expands, attention explodes, and suddenly everyone has an explanation for why it happened. The chart looks obvious.
Obviousness is not the same as strength.
The pattern worth flagging is volatility and price expansion arriving with nothing improving underneath them. Price expands sharply, NCS stays weak, and NCR climbs. That combination reads as reflexive activity rather than durable participation.
A fast move is not automatically a strong move.
Sometimes volatility is the start of real repricing. Sometimes it is noise travelling faster.
So Who Was Actually Buying That Candle?
Not a name. A composition.
For traders, reading the setup means looking across those layers instead of relying on the candle alone. If price rises while attention, community strength, and market pressure confirm the move, the setup has stronger support. If price rises while those signals diverge, the move deserves more scrutiny.
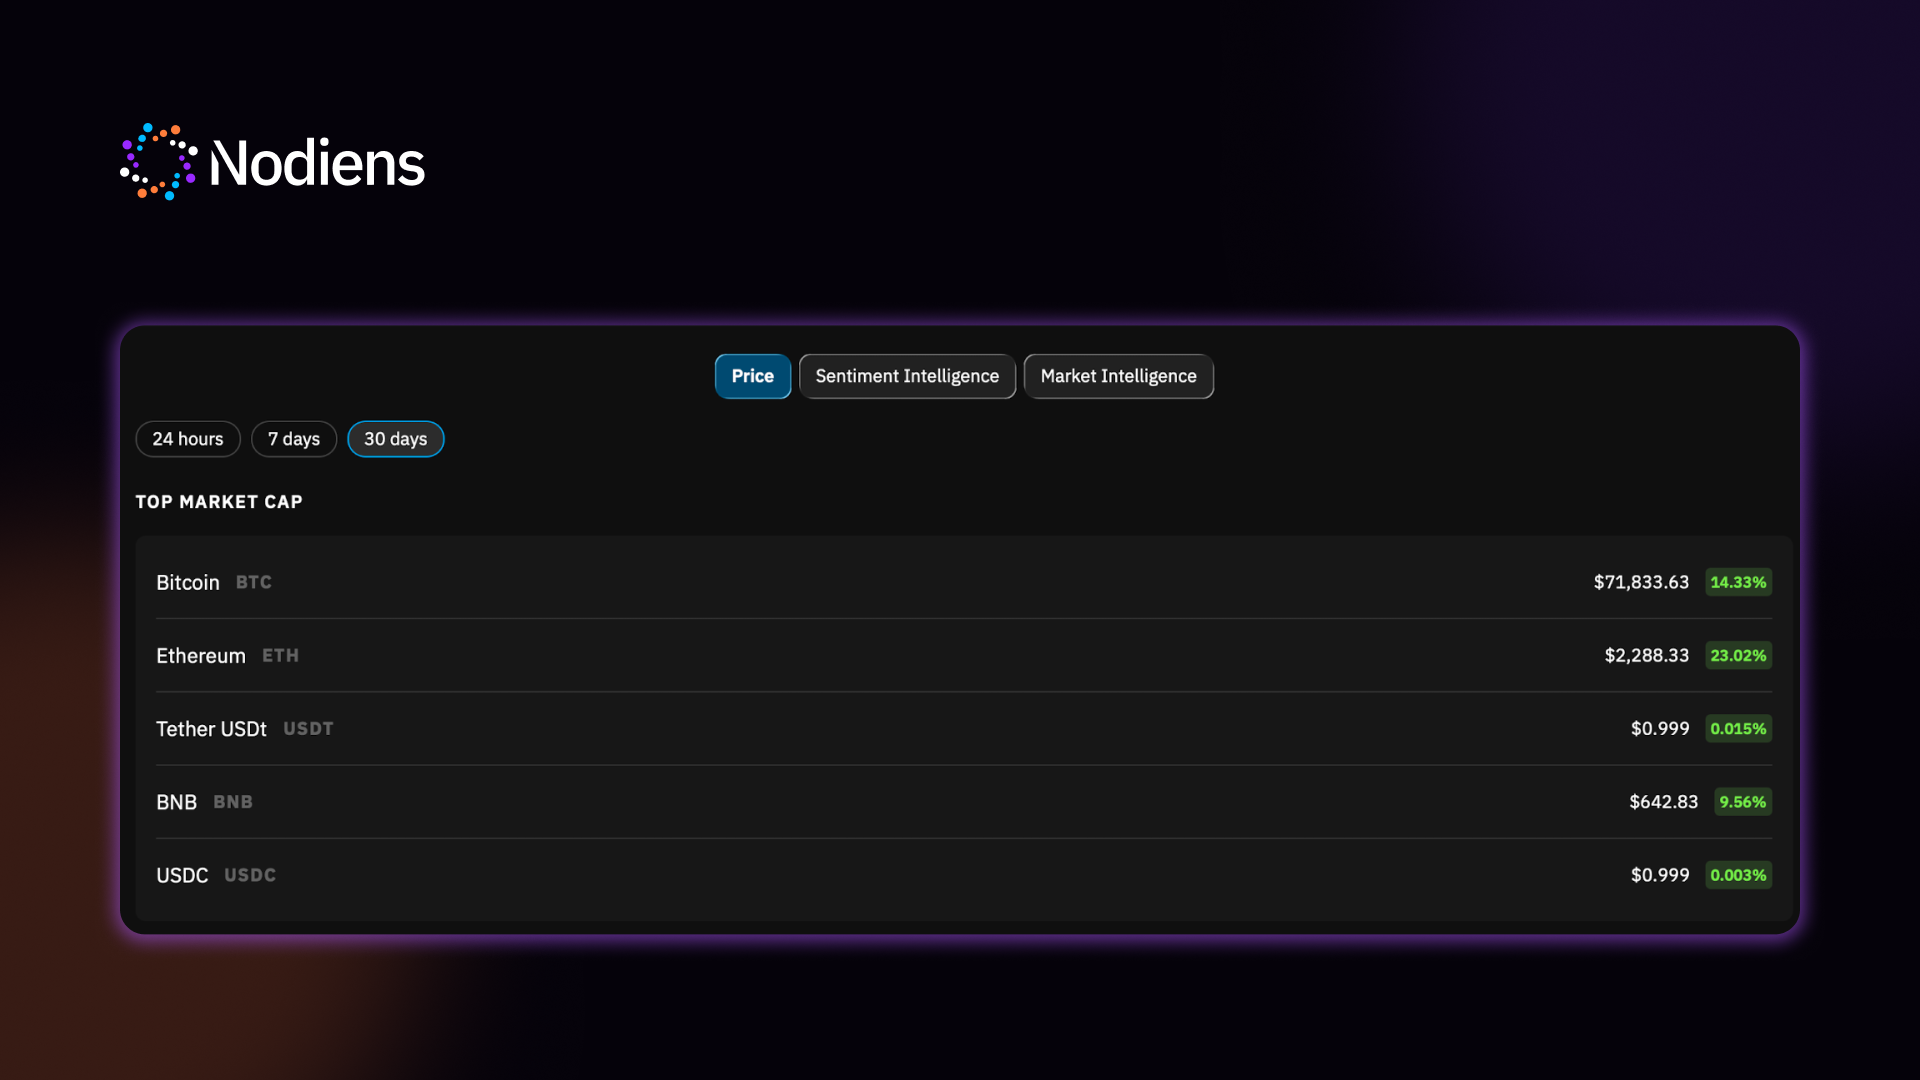
The price is the receipt. It tells you the transaction cleared. It does not tell you who paid, why they arrived, or whether they had a reason to stay.
That is the layer Nodiens reads.
More than 70k+ users are reading that layer inside Nodiens right now.
Sharpen your edge. Read the market behind the candle.
One platform. Every signal. app.nodiens.com
Nodiens indices are based on community and market data. They are not opinions, recommendations, or price predictions. Each score reflects current conditions.
What this does not tell you: These signals do not identify individual buyers or sellers, guarantee that demand will persist, or predict where price will move next. They provide context around market activity, attention, community behavior, and pressure, but the interpretation still depends on how those signals interact with one another.
Frequently Asked Questions
What is the Nodiens Market Intelligence Index?
The Nodiens Market Intelligence Index measures the strength of market pressure behind an asset’s price movement.
What is the Nodiens Spike Attention Index?
The Nodiens Spike Attention Index measures unusual changes in social attention around an asset.
Does high attention mean an asset is bullish?
Not necessarily. Attention can increase without meaningful demand or conviction, so it should be evaluated alongside community strength, risk, market pressure, and price.
What is the Nodiens Community Strength Index?
The Nodiens Community Strength Index measures the depth and quality of engagement around an asset.
What does the Nodiens Community Risk Index measure?
The Nodiens Community Risk Index reads the social layer for signs of artificial activity, including bot spam, coordinated messaging, fake engagement, and abnormal linguistic or account patterns.
Why can the same green candle mean different things?
A green candle only shows that price moved higher. The underlying move could be driven by sustained spot demand, leverage, distribution being absorbed by buyers, or attention that has not yet become durable demand.
How should traders read a market setup?
Traders can compare price with attention, market pressure, community strength, and risk. When these signals confirm one another, they provide stronger context; when they diverge, the mismatch can be a signal to investigate further.
Are Nodiens indices price predictions or trading recommendations?
No. Nodiens indices are based on community and market data and reflect current conditions. They are not opinions, recommendations, or price predictions.
What is absorption in crypto trading?
Absorption occurs when available supply is repeatedly met by enough buying demand to prevent the price from falling, allowing trades to continue at progressively higher prices. A rising price can therefore occur even while substantial selling is taking place.
What does rising social attention mean for a token?
Rising social attention means more unusual activity or discussion around a token compared with its normal range. It can indicate growing interest, but it does not automatically mean bullish demand or durable conviction, so it should be read alongside community strength, risk, market pressure, and price.